
AI Executive Summary
"This article provides a rigorous technical protocol for quantifying biological age through DNA methylation, moving beyond consumer-grade testing. It offers strategic value by bridging the gap between theoretical longevity and actionable, data-driven epigenetic monitoring."
Prerequisites for Epigenetic Monitoring
Establishing a baseline for epigenetic tracking requires more than a consumer-grade spit kit. You need access to high-resolution methylation arrays or deep bisulfite sequencing to move beyond superficial biological age estimates. The gold standard involves analyzing CpG sites—cytosine-guanine dinucleotides—where a methyl group attaches to the DNA, effectively silencing or activating genes without altering the underlying sequence. For a rigorous protocol, a practitioner must secure a partnership with a clinical laboratory capable of performing Illumina MethylationEPIC arrays or targeted NGS (Next-Generation Sequencing) panels. These tools allow for the measurement of methylation percentages across hundreds of thousands of sites, providing a granular view of cellular health that far exceeds the capabilities of basic genetic testing.
Data infrastructure is the second critical pillar. Raw methylation data is voluminous and noisy, necessitating specialized bioinformatic pipelines for normalization and quality control. You will require software capable of processing IDAT files and applying the Horvath or Hannum algorithms to calculate biological age. In emerging biotech hubs like Bengaluru, researchers are increasingly utilizing cloud-based computing to handle these massive datasets, allowing for real-time comparisons between a subject's chronological age and their epigenetic clock. Without a standardized pipeline for data cleaning, the resulting 'age' is merely a statistical artifact rather than a biological reality.
The Signal-to-Noise Ratio
Epigenetic clocks are not static. They represent a snapshot of cellular state. To detect a meaningful shift in biological age, a delta of at least 0.5 to 1.0 years is typically required to separate signal from stochastic noise.
The Methylation Tracking Workflow
- Sample Acquisition: Collect 10ml of venous blood in EDTA tubes or a high-yield buccal swab. Blood is preferred for systemic aging markers, while buccal cells provide a localized view of epithelial aging.
- DNA Extraction and Bisulfite Conversion: Treat the genomic DNA with sodium bisulfite. This process converts unmethylated cytosines to uracil while leaving methylated cytosines intact, creating a permanent record of the epigenetic state.
- Array Hybridization or Targeted Sequencing: Load the converted DNA onto a methylation array (e.g., EPIC v2.0) or perform targeted bisulfite sequencing on specific CpG islands associated with inflammatory pathways.
- Bioinformatic Normalization: Apply background subtraction and dye-bias correction to the raw intensity data to ensure results are comparable across different testing dates.
- Clock Calculation: Input the normalized beta-values into an epigenetic clock algorithm to determine the biological age and the 'age acceleration' metric.
- Intervention Correlation: Map the changes in methylation patterns against specific lifestyle variables, such as caloric restriction or pharmacological agents, over a 6-to-12 month interval.
The conversion step is where most protocols fail. Sodium bisulfite treatment is harsh and can degrade a significant portion of the DNA template. If the DNA concentration drops below a critical threshold, the resulting data becomes erratic, leading to false positives in age acceleration. High-end laboratories utilize enzymatic conversion methods to preserve DNA integrity, which is particularly vital when working with limited sample volumes. This technical nuance determines whether you are measuring actual biological decay or simply the degradation of your sample in a test tube.
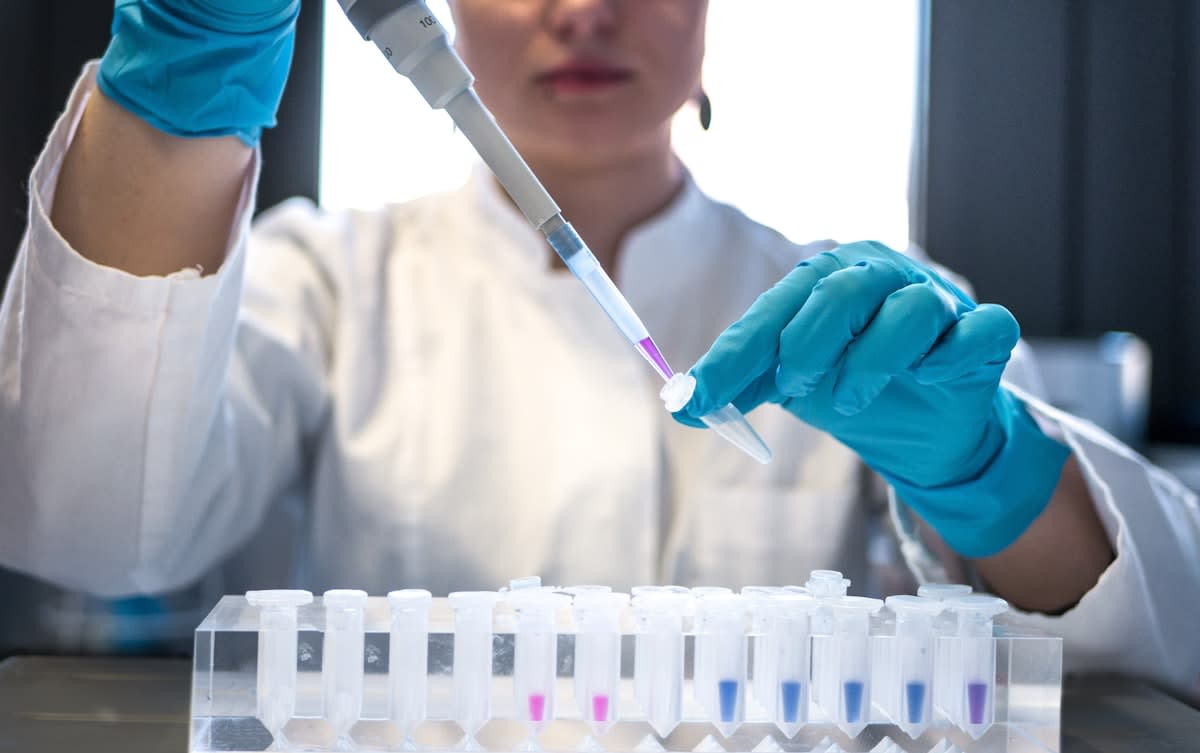
Once the data is normalized, the focus shifts to the beta-value—the ratio of methylated probes to the total number of probes at a specific site. A beta-value of 0 indicates total hypomethylation, while 1 indicates total hypermethylation. By tracking these values across a panel of 353 CpG sites (as in the original Horvath clock), one can derive a weighted average that correlates with chronological age. However, the true value for the practitioner lies in the outliers. Why is a specific promoter region for a pro-inflammatory cytokine hypermethylated in one subject but not another? These anomalies often point to specific environmental stressors or genetic predispositions.
| Clock Model | Primary Focus | Predictive Power | Best Use Case |
|---|---|---|---|
| Horvath (Pan-Tissue) | General Cellular Age | High (Across Tissues) | Baseline Biological Age |
| PhenoAge | Mortality Risk | Very High (Clinical) | Healthspan Prediction |
| GrimAge | Lifespan Exhaustion | Highest (Mortality) | End-of-Life Tracking |
| DNAmAge | Chronological Alignment | Moderate | Quick Screening |
Comparing these clocks reveals the difference between 'aging' and 'decay.' A subject might have a Horvath age that matches their chronological age but a PhenoAge that is five years older. This discrepancy suggests that while their general cellular turnover is normal, their physiological systems are under stress, likely due to metabolic dysfunction or chronic inflammation. In the context of the Indian Subcontinent, where metabolic syndrome is prevalent due to a combination of genetic predisposition and dietary shifts, the PhenoAge clock often provides a more urgent warning than general aging clocks.
Does the data actually respond to intervention? This is the central question of any tracking protocol. If a subject implements a rigorous fasting-mimicking diet or a specific pharmacological regimen, the methylation status of genes related to autophagy or sirtuin activity should shift. For example, tracking the methylation of the promoter region for the SIRT1 gene can provide a direct proxy for the effectiveness of NAD+ precursors. If the methylation levels decrease, the gene is more likely to be expressed, suggesting the intervention is working at a molecular level.

The temporal frequency of testing is a balancing act. Testing every month is useless because epigenetic shifts occur over longer horizons. A quarterly or semi-annual cadence is optimal. This allows enough time for the biological system to integrate the intervention and for the methylation patterns to stabilize. Tracking biological age over three years with six-month intervals creates a trajectory line. A downward slope in biological age—effectively 'reversing' the clock—is the ultimate validation of a longevity protocol.
Privacy and data sovereignty are non-negotiable when dealing with epigenetic data. Unlike a standard blood test, a methylation map is a highly personal blueprint that can reveal not just age, but potential disease predispositions and historical environmental exposures. Using encrypted, local storage for raw IDAT files and ensuring that the analysis pipeline is decoupled from identifiable personal information is a prerequisite for any professional-grade setup.
Common Pitfalls in Epigenetic Tracking
- Tissue Specificity Error: Assuming that a buccal swab accurately reflects the biological age of the liver or heart. Each tissue has its own methylation signature.
- Over-reliance on Single Clocks: Using only the Horvath clock and ignoring PhenoAge, which leads to a blind spot regarding actual mortality risk.
- Ignoring Stochastic Noise: Mistaking a 0.2-year change in biological age for a successful intervention when it is actually within the margin of error.
- Poor Sample Storage: Allowing DNA samples to undergo freeze-thaw cycles, which can introduce artifacts into the bisulfite conversion process.
- Lack of Baseline Control: Failing to establish a multi-sample baseline before starting an intervention, making it impossible to determine the starting point of biological decay.
The most dangerous mistake is the 'biohacker's fallacy'—the belief that a lower biological age number automatically equates to better health. Epigenetic age is a proxy, not a diagnosis. A person can have a 'young' epigenetic age but still suffer from an acute pathology that the clock is not designed to detect. The protocol must therefore be integrated with traditional clinical biomarkers, such as ApoB, HbA1c, and high-sensitivity C-reactive protein, to provide a complete picture of systemic health.